June 20, 2026
NOT THIS TIME, YA DON'T
Big wins, important wins


First, the disclaimer: Past performance does not indicate future results. Especially in the VAFA Premier section.
So look on these numbers if you are interested, but don't cite them as a reason why anything in the football future happens. We might find that these trends continue, but there are always outliers and exceptions that buck the trend. That said, let's have a look at some numbers from the first half of the 2026 home and away Premier season and what these have meant in the recent past.
The 13 year comparisons we have to work with are the completed pre-COVID seasons 2011-2019 and those since resumption 2022-2025.
Of course, the home and away season is 18 games long and very little is set in stone before the final push. Of course, if look at the past, we can see some trends.
Here we go ...
Across the 13 completed seasons, the Round 9 rank has had a strong relationship with eventual fate.
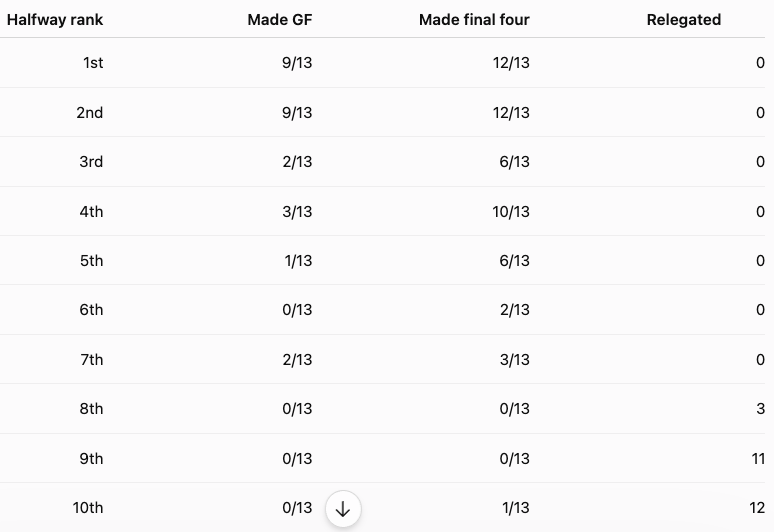
So, the blunt version: top two at halfway usually made the Grand Final material, but not always; and bottom two are usually doomed.
The top two after Round 9 produced 18 of the 26 Grand Finalists, or 69.2%. The top four after Round 9 produced 40 of the 52 finalists, or 76.9%.
The first two spots are gold. Halfway leaders and second-placed teams both reached the Grand Final 9 times from 13.
But third is surprisingly unstable. Teams sitting 3rd after Round 9 made the final four only 6 times from 13, and only 2 reached the Grand Final. Fourth was actually a better finals indicator, with 10 of 13 making finals.
That suggests the common ladder shape is: two clearly strong sides, then a messy middle where 3rd to 7th can still shift around.
The record-based trend is very strong.
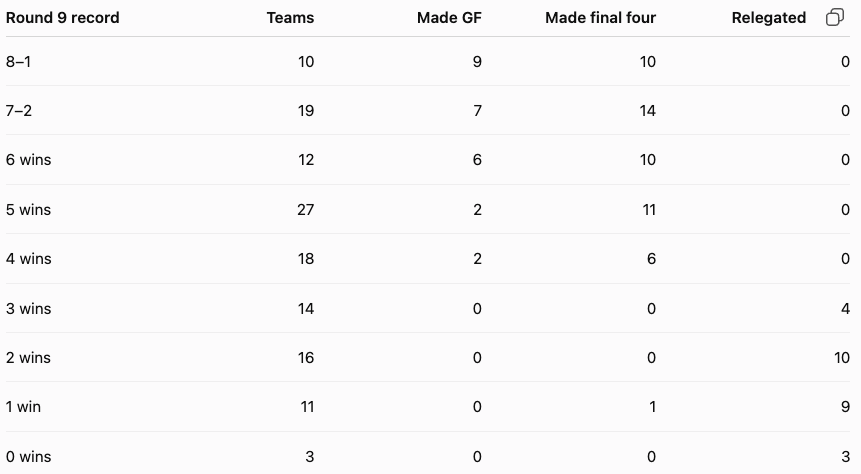
The big threshold is six wins. Teams with 6+ wins after Round 9 made finals 32 times from 41, or 78%, and never got relegated.
Teams with 3 wins or fewer almost never recovered into finals. In fact, only one team with fewer than four wins after Round 9 made finals: De La Salle in 2015, who were 1–8 and 10th at halfway but finished 4th. That is the monster outlier in the whole table.
Percentage is a very strong indicator, especially at the extremes.

The cleanest rule: a team above 130% after Round 9 is almost certainly a finalist and very likely a Grand Finalist.
Teams under 80% are in deep trouble: 21 of 27 were relegated, and only one made finals — again, 2015 De La Salle.
The best percentage team after Round 9 made the final four in all 13 completed seasons, and reached the Grand Final in 10 of 13.
The team with the best defence — lowest points against — made finals in 12 of 13 seasons, and reached the Grand Final in 9 of 13.
The team with the highest points for also made finals in 12 of 13 seasons, and reached the Grand Final in 11 of 13.
So, attacking power has been slightly more Grand Final-aligned, but both are very strong. The ideal historical profile is obvious: high scoring plus top-three defensive numbers.
Teams with one but not the other have been proven vulnerable.
This is one of the strongest patterns in the whole table.
The bottom two at Round 9 were relegated 23 times from 26, or 88.5%.
The exceptions were:

So, 8th is the danger seat, especially with weak percentage. Ninth and tenth are usually already in the trapdoor zone.
The table’s most interesting space is 5th to 7th after Round 9.
Teams sitting 5th made finals 6 times from 13.
Teams sitting 6th made finals only 2 times from 13.
Teams sitting 7th made finals 3 times from 13, including two Grand Finalists: Old Xaverians 2016, who were 7th at halfway and won the flag, and Old Scotch 2025, who were 7th and reached the Grand Final.
That suggests a team can launch from 7th, but usually only if the percentage says they are better than their rank.
The classic example is Old Xaverians 2016: 7th at 4–5, but with a percentage of 117.74. That was a fake 7th.
The eventual premiers had an average halfway profile of:

That is a neat ladder of quality. Premiership sides are generally not lurking quietly. They are normally already top two with a big percentage.
The only real premiership bolters were:
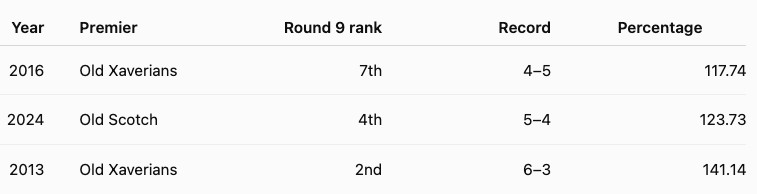
Even those “bolters” had strong percentage, especially 2016 Xavs. They were not playing like a normal 7th side.
A few cases have stood out.
2015 De La Salle is the wildest: 10th at halfway, 1–8, percentage 79.12, finished 4th. That is the table’s great escape / late-season surge.
2016 Old Xaverians are the premiership version: 7th at halfway, 4–5, percentage 117.74, finished 1st. The percentage told the truth before the ladder did.
2025 Old Scotch were 7th at halfway, 4–5, percentage 96.70, finished 2nd. That is a major late-season climb, and less obviously foretold by percentage than 2016 Xavs.
2018 Old Melburnians were 4th at halfway but finished 8th. That is one of the sharper fades from a finals position.
From this table, we’d summarise the trends like this:
A team that is 8–1 after Round 9 is essentially a Grand Final-level side.
A team that is 7–2 with 130%+ is a serious flag threat.
A team with 6+ wins is very likely to play finals.
A team with 5 wins is in the true toss-up zone: 11 of 27 made finals.
A team with 4 wins but strong percentage can still be dangerous.
A team with 3 wins or fewer is almost certainly out of finals contention.
A team in the bottom two after Round 9 is overwhelmingly likely to be relegated.
A team below 80% is in relegation-grade territory unless something dramatic changes.
For 2026, by historical performances, Old Xaverians, Uni Blues, Old Brighton and St Kevin’s look like a very strong prospective finals group.
By the same measure, Caulfield and Old Trinity are in the mid-table “possible but difficult” zone.
The danger signs are strongest for St Bernard’s, with Old Scotch and Old Haileybury, but there's a long way to go.